

Krater Model Usage Index: Which AI Models Actually Run the Work
The Krater Model Usage Index analyzes model-class execution, provider share, job mix, and multi-model behavior in Krater production logs without publishing account counts.
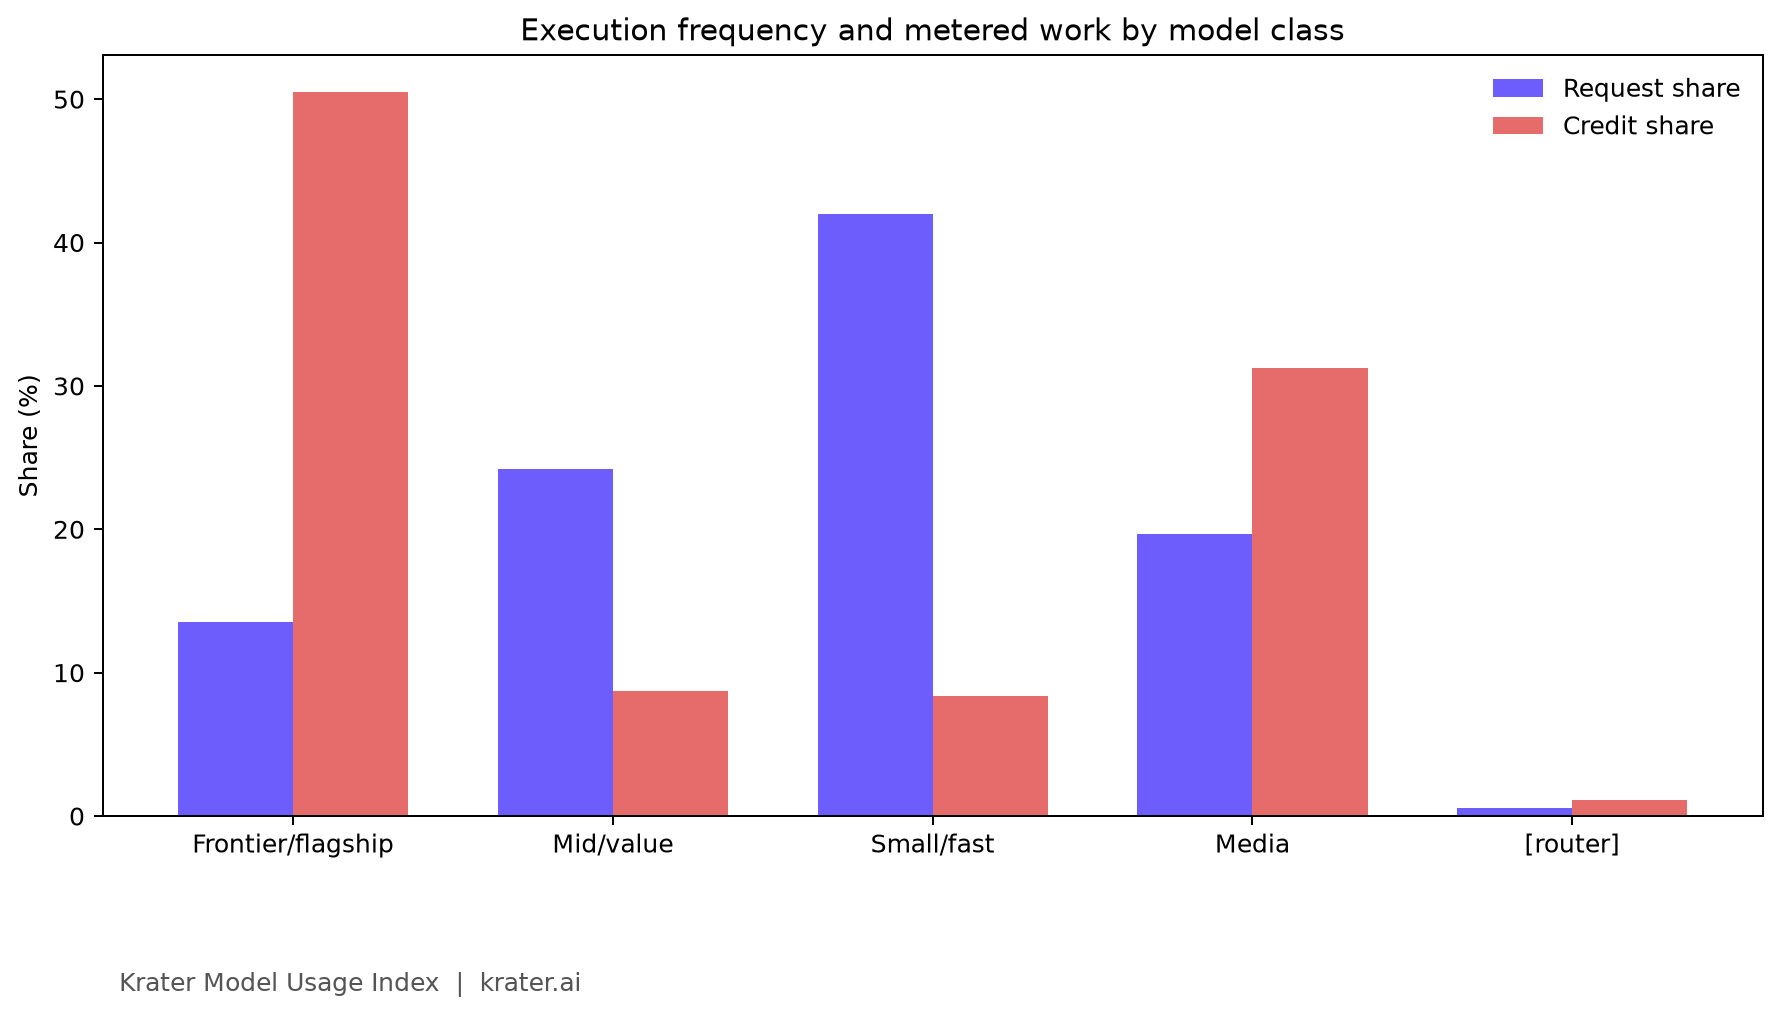
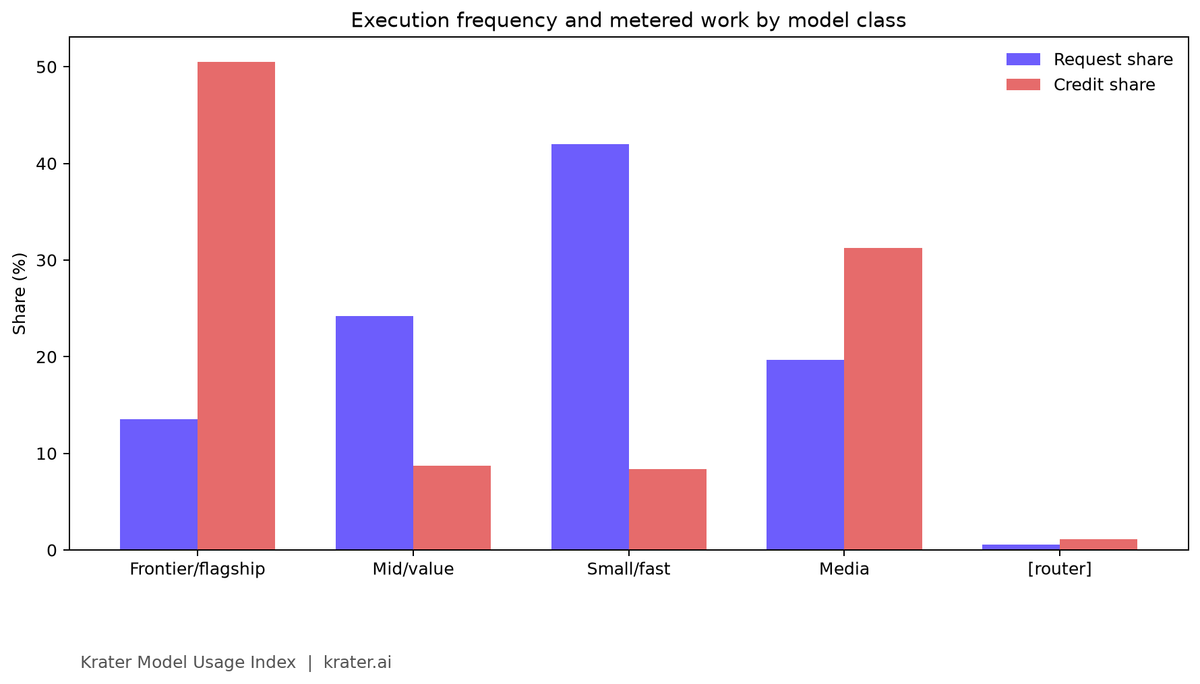
The Krater Model Usage Index measures which models actually ran work in Krater production logs, not what the AI industry uses as a whole. In the 12-month window, 188,339 model-attributed requests were available for the request-share cut. Small and fast models accounted for 41.98% of requests but only 8.38% of charged credits, while frontier/flagship and media classes together accounted for 33.22% of requests and 81.80% of charged credits. The median active account ran 5 distinct models in a 90-day window.
Key takeaways
Execution frequency and metered work diverge: small and fast models represented 41.98% of requests and 8.38% of credits. Frontier/flagship and media classes represented 33.22% of requests and 81.80% of credits.
- The request-share denominator is 188,339 model-attributed requests in the 12-month query window ending 2026-08-11.
- Routers are reported separately because automatic routing is not a concrete model assignment.
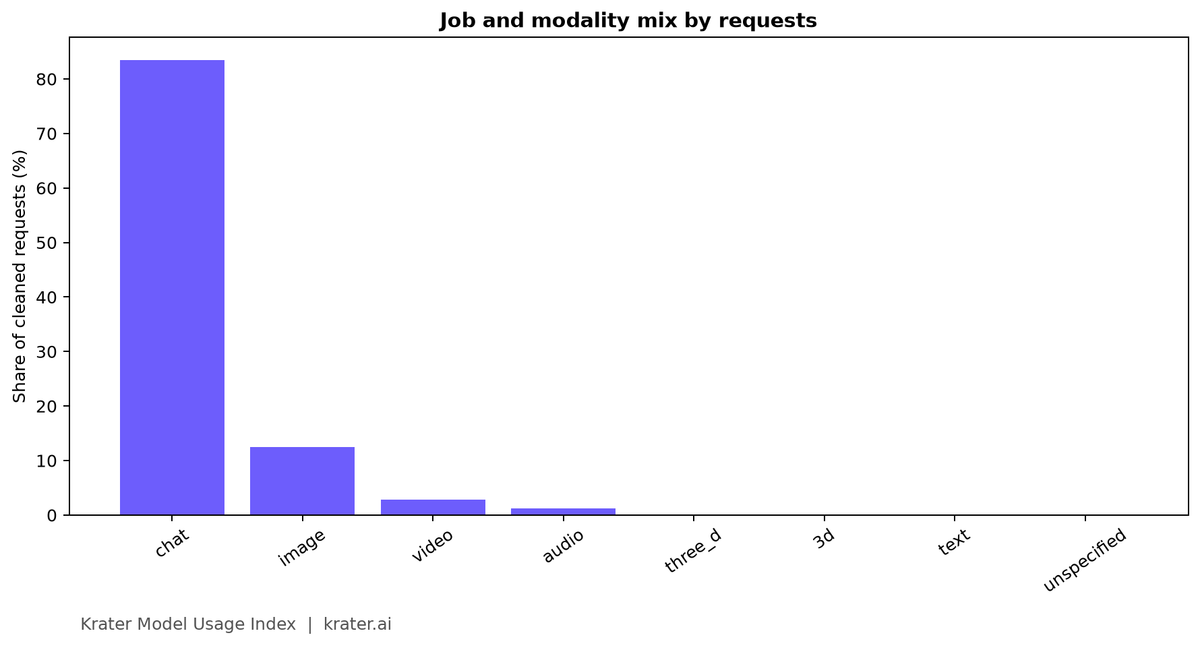
- After excluding test and smoke rows, chat represented 83.46% of reservation requests, followed by image at 12.46%, video at 2.79%, and audio at 1.26%.
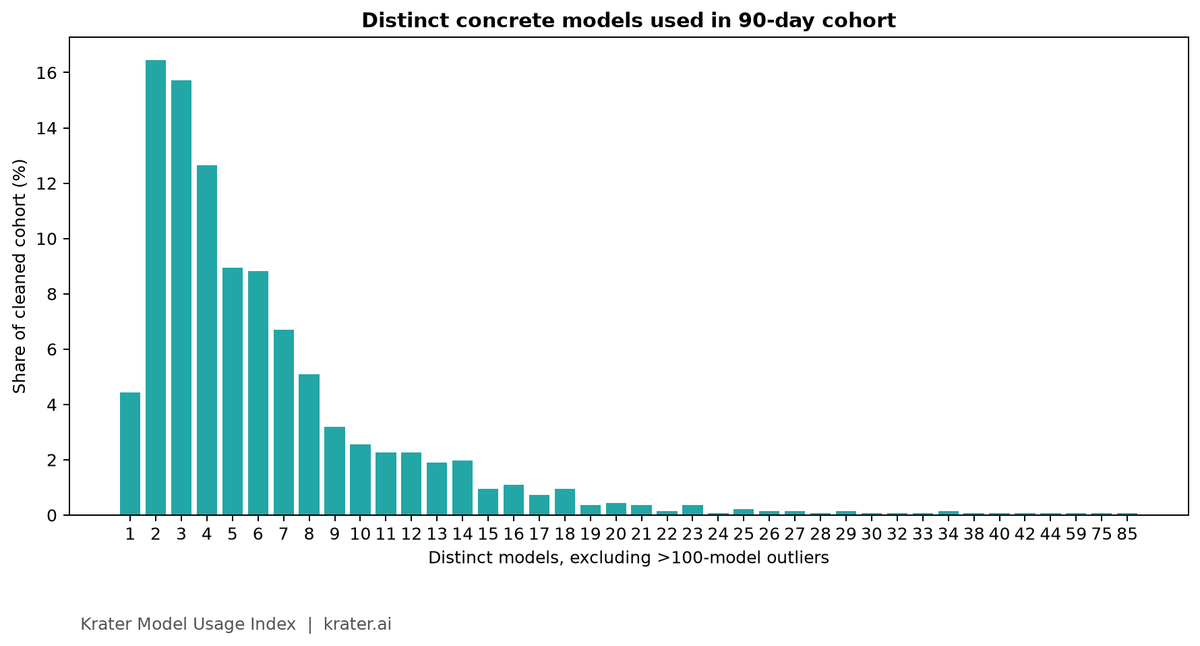
- After excluding observations above 100 distinct concrete models, the median active account ran 5 distinct models in a 90-day window and the mean was 6.36. Percentages are published without account totals.
- In the 90-day job distribution, 21.11% of active accounts ran three or more job types.
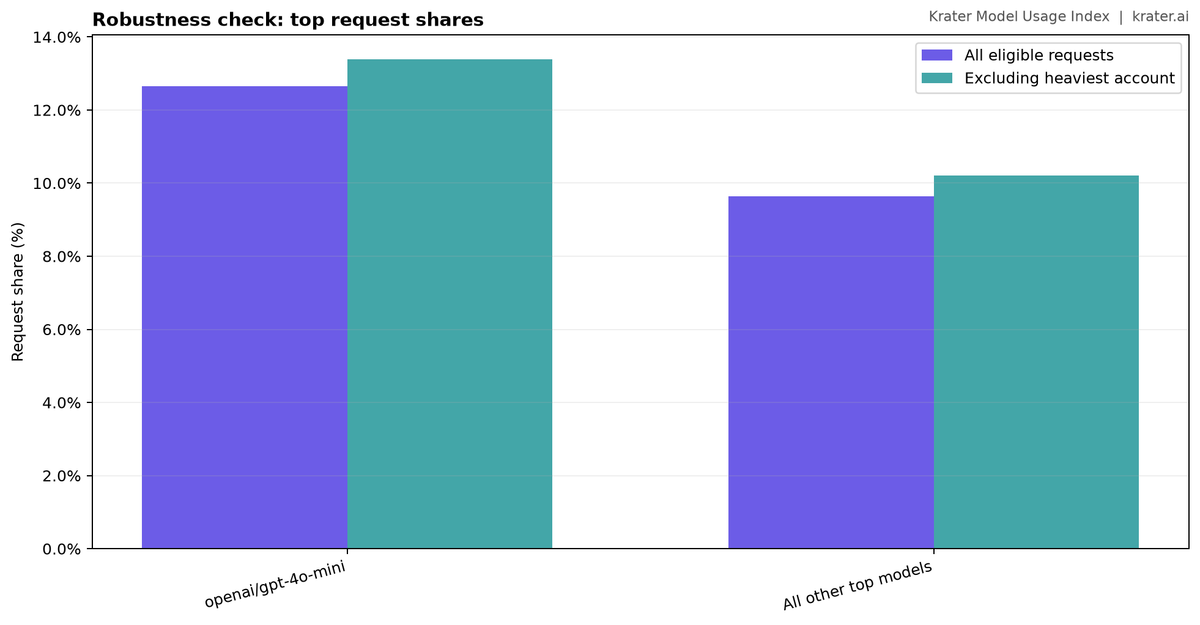
- The Q7 robustness check left the leading class and overall shape stable after excluding the single heaviest account.
What this index measures
This is a usage study of Krater's production aggregates. It describes which models and job types actually ran in the selected logs. It does not estimate the AI market, rank model quality, or claim that Krater users represent all AI users. Request share counts executions. Credit share weights the same activity by credits charged, so heavier models, longer jobs, and media operations can account for much more work per request.
The logged model is not always a user choice. The current audit schema records the model that ran and the function name, but not a durable selection-source field. Therefore this report does not publish an invented percentage split between user-selected, default, and feature-assigned traffic.
Assignment provenance: what the logs can and cannot prove
Repository and function evidence shows that production traffic combines explicit model selection, defaults, feature-assigned endpoints, and router resolution. The current audit schema records the model that ran and the function name, but not a durable selection-source field. Function-level evidence identifies a substantial feature-assigned share, while the remaining traffic cannot be separated exactly between explicit selection and fallback. The class-level analysis avoids treating execution frequency as a pure selection survey.
Execution by model class
The class mapping is applied consistently to request and credit data. The request denominator is 188,339 model-attributed requests; the credit denominator is 2,439,312.16 credits across model-attributed reservations. Classes are mutually exclusive, and routers remain a separate row.
| Model class | Request share | Credit share |
|---|---|---|
| Frontier/flagship | 13.52% | 50.53% |
| Mid/value | 24.21% | 8.73% |
| Small/fast | 41.98% | 8.38% |
| Media | 19.70% | 31.27% |
| [router] | 0.59% | 1.09% |
Request share measures how often a class ran. Credit share weights the same activity by credits charged, so heavier models, longer jobs, and media operations can account for more metered work per request.
Provider-level share
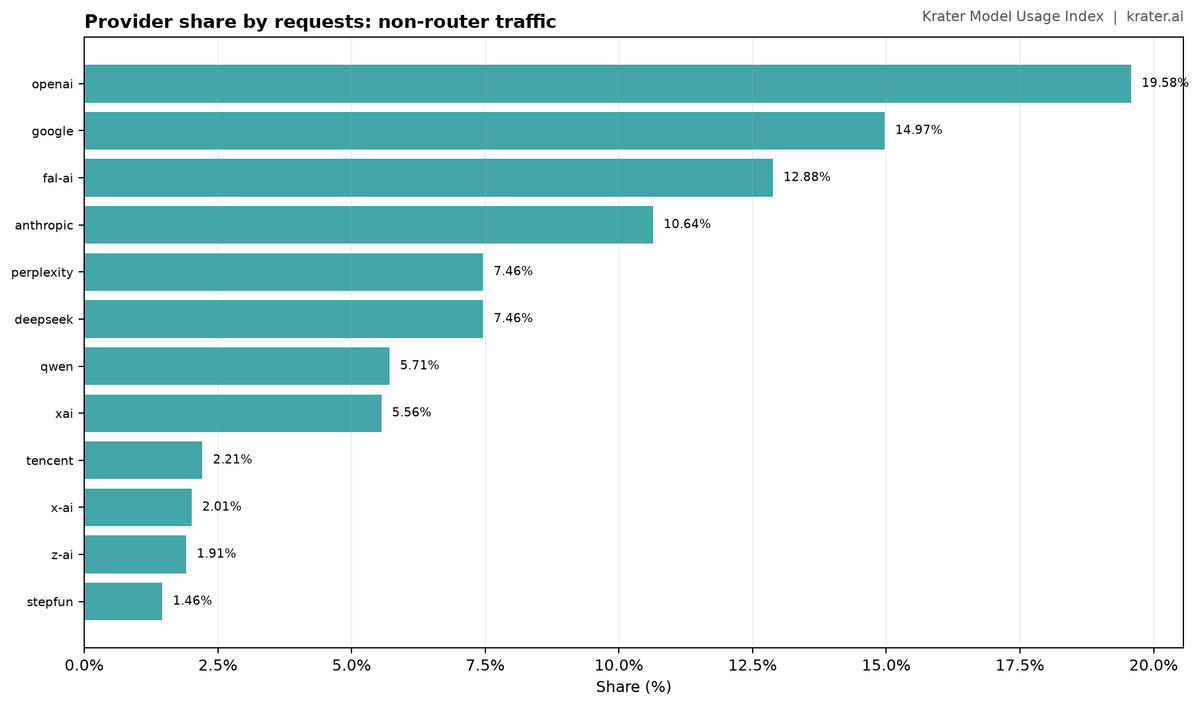
Q8 rolls up non-router request rows by the provider prefix before the slash. The denominator is 187,231 non-router requests in the 12-month window. Provider prefixes are more stable for a report than a long list of model IDs, although aliases and provider naming conventions still require care.
| Provider prefix | Requests | Share |
|---|---|---|
| openai | 36,668 | 19.58% |
| 28,022 | 14.97% | |
| fal-ai | 24,116 | 12.88% |
| anthropic | 19,917 | 10.64% |
| perplexity | 13,974 | 7.46% |
| deepseek | 13,970 | 7.46% |
| qwen | 10,695 | 5.71% |
| xai | 10,401 | 5.56% |
| tencent | 4,144 | 2.21% |
| x-ai | 3,754 | 2.01% |
| z-ai | 3,570 | 1.91% |
| stepfun | 2,742 | 1.46% |
| nvidia | 1,952 | 1.04% |
| aion-labs | 1,258 | 0.67% |
| clarityai | 1,170 | 0.62% |
What people use AI for
Q3 uses the reservation log's task_type, then feature, then "unspecified". Test, smoke_test, and smoke rows are excluded from the published mix and the remaining percentages are renormalized. The cleaned 12-month denominator is 264,452 reservations.
| Job or modality | Requests | Credits | Cleaned request share |
|---|---|---|---|
| chat | 220,700 | 1,957,720.65 | 83.46% |
| image | 32,947 | 393,761.00 | 12.46% |
| video | 7,370 | 715,727.00 | 2.79% |
| audio | 3,336 | 74,158.00 | 1.26% |
| three_d | 84 | 10,503.00 | 0.03% |
| 3d | 12 | 923.00 | 0.00% |
| text | 2 | 1.00 | 0.00% |
| unspecified | 1 | 1.00 | 0.00% |
Multi-model behavior
Q4 and Q4b use a 90-day daily_usage cohort and exclude router-like IDs. To remove an obvious non-human or internal-style outlier, the published distribution excludes observations with more than 100 distinct concrete models. After that rule, the median is 5 distinct concrete models, the mean is 6.36, and the maximum is 85. No account count or identity is published.
| Distinct models used | Share of cleaned 90-day cohort |
|---|---|
| 1 | 4.44% |
| 2 | 16.45% |
| 3 | 15.72% |
| 4 | 12.66% |
| 5 | 8.95% |
| 6 | 8.81% |
| 7 | 6.70% |
| 8 | 5.09% |
| 9 | 3.20% |
| 10 | 2.55% |
| 11 | 2.26% |
| 12 | 2.26% |
| 13 | 1.89% |
| 14 | 1.97% |
| 15 | 0.95% |
| 16 | 1.09% |
| 17 | 0.73% |
| 18 | 0.95% |
| 19 | 0.36% |
| 20 | 0.44% |
| 21 | 0.36% |
| 22 | 0.15% |
| 23 | 0.36% |
| 24 | 0.07% |
| 25 | 0.22% |
| 26 | 0.15% |
| 27 | 0.15% |
| 28 | 0.07% |
| 29 | 0.15% |
| 30 | 0.07% |
| 32 | 0.07% |
| 33 | 0.07% |
| 34 | 0.15% |
| 38 | 0.07% |
| 40 | 0.07% |
| 42 | 0.07% |
| 44 | 0.07% |
| 59 | 0.07% |
| 75 | 0.07% |
| 85 | 0.07% |
The median remains 5 after outlier exclusion, while the mean moves from the unfiltered 6.61 to 6.36. That supports leading with the median rather than the maximum.
Cross-job behavior
Q5 asks how many distinct job types appeared in the same 90-day cohort. It reports percentages only: 1 job types: 44.74%; 2 job types: 34.15%; 3+ job types: 21.11%. The 3+ bucket is the clearest multi-job signal, but it should not be turned into an account count.
Robustness check
Q7 recomputes the 12-month request share after excluding the single heaviest account. The leading class and the overall request-share shape remained stable after excluding the single heaviest account. The robustness result does not identify an individual model or publish account counts. This is a small enough movement that the headline is not being set by one power user, while the exclusion remains disclosed.
New model adoption speed
Q6 and Q6b were run as specified, but this study does not promote them to a headline metric. Q6 returned 227 catalogue candidates, including free, batch, alias, image, router, and latest-name variants. Q6b therefore produces a heterogeneous set of 30-day windows, many with zero or partial observations. That is not a clean single adoption-speed statistic. The complete raw Q6 and Q6b results remain in the internal results file for review, but the public draft drops this metric rather than implying a comparable launch benchmark.
Charts
How this compares with a workspace
The public tables describe observed model execution in one multi-model workspace. They are not a recommendation to assemble separate provider accounts or call raw APIs directly. Readers comparing workspace breadth with autonomous agent execution can see Best Manus Alternatives. Direct APIs do not themselves provide Krater's interface, storage, Agents, shared workspace, or multimodal tooling.
| Option | Access model | What this index can show | Limitation |
|---|---|---|---|
| Krater Pro (Recommended) | One workspace with 350+ models and shared credits | The index shows how real Krater usage is distributed across models and jobs. | Usage varies by cohort and period; this is not an industry census. |
| Direct provider APIs | Separate provider accounts and interfaces | A provider can report its own traffic or billing. | That view cannot show cross-provider execution in one workspace. |
| A single-model app | One model family | A single-model product can measure its own execution. | It cannot show multi-model switching across providers. |
Verdict: The usage index supports a focused claim: Krater production logs show execution across many concrete models and job types, while request share and credit share emphasize different parts of the workload. It does not support a market-wide model execution ranking.
Methodology and limitations
Sources: Q1, Q7, and Q8 use api_request_audit. Q2, Q3, and Q5 use credit_reservations. Q4 and Q4b use daily_usage. Q6 uses model_archive, with Q6b run once per Q6 candidate. All queries were run read-only against the production project using the authoritative query file without changing its definitions.
Assignment provenance: The repository shows explicit defaults, selectable models, feature-assigned endpoints, and router resolution. The audit records the model that ran and function_name but no selection-source field, so it cannot produce a complete user-selected versus default versus feature-assigned percentage split. Window: The request and credit queries use a trailing 12-month bound from each source table's maximum timestamp. The observed audit range ends at 2026-08-11 21:45:07.949054+00 and has available audit rows beginning 2026-01-08 12:13:19.469682+00. Q4, Q4b, and Q5 use trailing 90-day bounds. Published denominators are requests, reservations, or percentages, never account totals.
Routers: Any model ID containing "auto" is bucketed as [router] for Q1 and Q2 and excluded from Q4, Q4b, and Q8 as authored. Routers represent automatic routing, not a concrete user model choice.
Instrumentation boundaries: Agent runs begin on 2026-06-16, agent attribution begins on 2026-08-02, and agent telemetry stops in mid-June. This index does not splice those agent-specific sources into its headline series, so it does not imply continuous historical coverage across every product surface.
Robustness: Q7 excludes the single heaviest account and leaves the leading class and overall shape stable. The result is more stable than a power-user-driven headline, but it remains a production-log study rather than a census.
Exclusions and data quality: Q3 excludes test, smoke_test, and smoke rows and renormalizes the remaining mix to 264,452 reservations. Q4 excludes observations above 100 distinct concrete models, changing the mean from 6.61 to 6.36 while leaving the median at 5. Null model rows are excluded where the authoritative query says model is required. Job mix follows the logged task_type and feature fallback. Model IDs can include aliases, modality-specific endpoints, batch variants, free variants, and routers. Q6 adoption speed was dropped from the headline because those categories and uneven windows make one clean comparison indefensible.
Raw aggregate data: The aggregate CSV is prepared at model-usage-index-aggregates.csv. It includes the class mapping used for both request and credit shares. It includes the class mapping used for both request and credit shares. It includes the class mapping used for both request and credit shares. It includes the class mapping used for both request and credit shares. It contains percentages and event-level aggregate values only, with no per-account rows and no account counts. It includes the cleaned Q3 and Q4 outputs used in this draft.
Update schedule: This is a snapshot study. If published, the intended update cadence is monthly, with each update recording the query window, source tables, and instrumentation boundaries.
Cite this study
Ready-to-copy attribution: Krater. Krater Model Usage Index. Production usage snapshot, 2026. https://krater.ai/blog/ai-model-usage-index
License: The charts, tables, and text of this study are available under CC BY 4.0. Reuse requires attribution and a link to the canonical study URL. This license does not claim ownership of the underlying facts or source-system records.
FAQs
Is this a market share report?
No. It reports model execution visible in Krater's production logs, not the AI industry.
Why show both requests and credits?
Requests show execution frequency. Credits show how much metered work was charged. They answer different questions.
Why is the router separate?
An automatic router is a serving mechanism, not a concrete model assignment. Folding it into a named model would misstate what ran.
Does the index publish account totals?
No. The study publishes request and reservation denominators plus percentage distributions, while deliberately withholding account totals.
Does the median of five models mean every user switches five models?
No. It is the median of the defined 90-day cohort after excluding router-like IDs and observations above the documented 100-model outlier threshold. It describes this cohort and window only.
Why is adoption speed not a headline?
The candidate set includes heterogeneous IDs and uneven launch windows. A shorter report is more credible than a padded metric.
Bottom line
The most defensible story is not that Krater users represent everyone or that every logged execution was explicitly selected. It is that one workspace makes measurable multi-model and multi-job execution visible: small and fast classes account for 41.98% of requests but 8.38% of credits, while frontier/flagship and media classes show the inverse pattern. The median active account ran five distinct models in a 90-day window. These are bounded, reproducible observations from Krater production logs.
Related reads
Want to apply the findings? Krater brings 350+ models, chat, image, video, voice, music, documents, files, coding, workspace tools, and Agents into one subscription with one shared credit pool. Get Started and use code BLOG15YEAR for 15% off for 12 months.